
 Facebook
 X
X
 Pinterest
 Copy Link

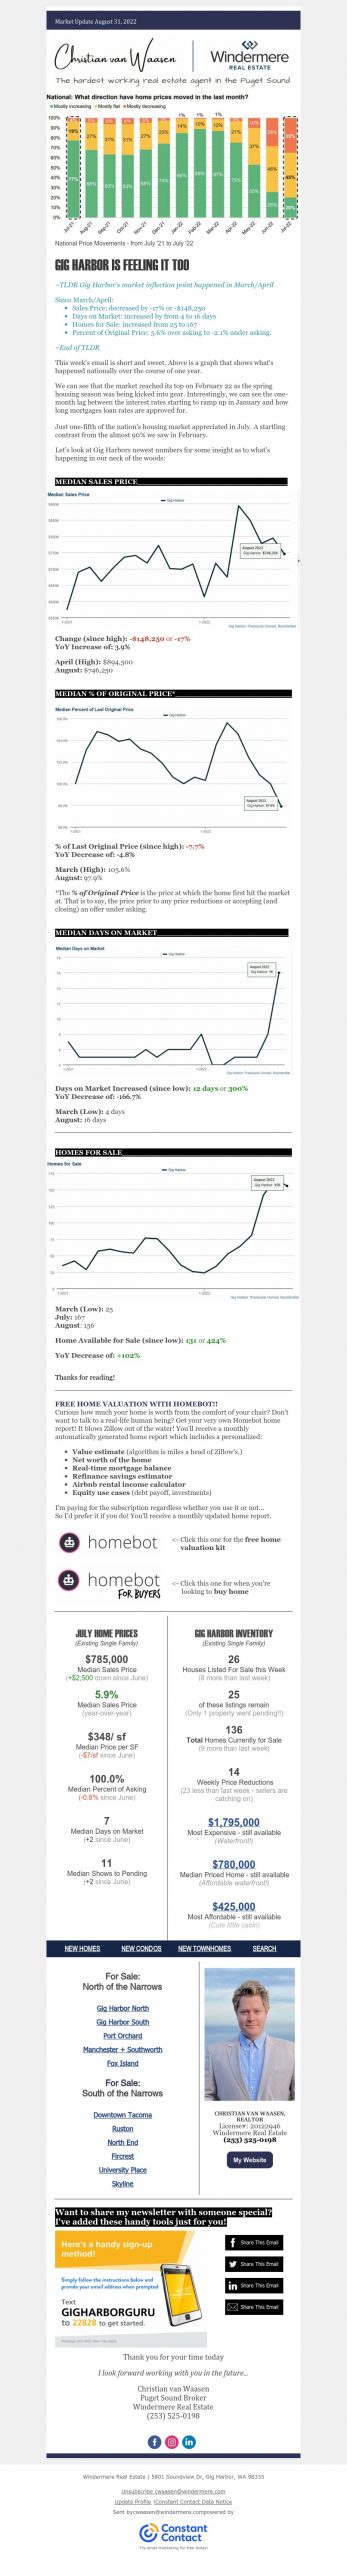
GIG HARBOR IS FEELING IT TOO
~TLDR Gig Harbor’s market inflection point happened in March/April
Since March/April:
- Sales Price: decreased by -17% or -$148,250
- Days on Market: increased by from 4 to 16 days
- Homes for Sale: increased from 25 to 167
- Percent of Original Price: 5.6% over asking to -2.1% under asking.
~End of TLDR
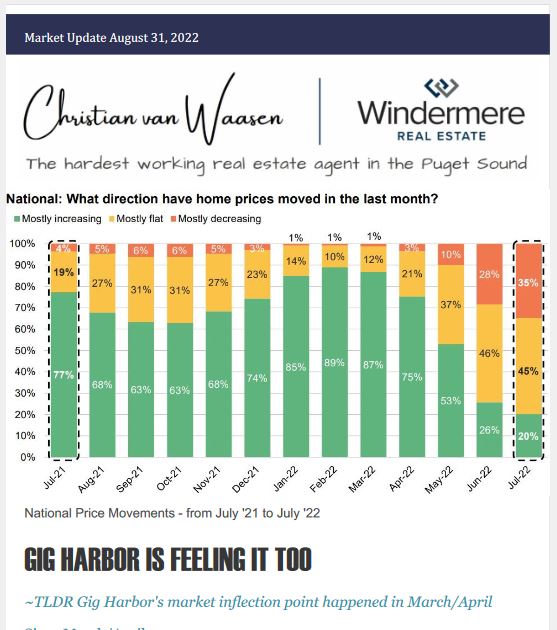
This week’s email is short and sweet. Above is a graph that shows what’s happened nationally over the course of one year.
We can see that the market reached its top on February 22 as the spring housing season was being kicked into gear. Interestingly, we can see the one-month lag between the interest rates starting to ramp up in January and how long mortgages loan rates are approved for.
Just one-fifth of the nation’s housing market appreciated in July. A startling contrast from the almost 90% we saw in February.
MEDIAN SALES PRICE
Change (since high): -$148,250 or -17%
YoY Increase of: 3.9%
April (High): $894,500
August: $746,250
MEDIAN % OF ORIGINAL PRICE*
% of Last Original Price (since high): -7.7%
YoY Decrease of: -4.8%
March (High): 105.6%
August: 97.9%
MEDIAN DAYS ON MARKET
Days on Market Increased (since low): 12 days or 300%
YoY Decrease of: -166.7%
March (Low): 4 days
August: 16 days
HOMES FOR SALE
March (Low): 25
July: 167
August: 156
Home Available for Sale (since low): 131 or 424%
YoY Decrease of: +102%
Thanks for reading!


