
 Facebook
 X
X
 Pinterest
 Copy Link
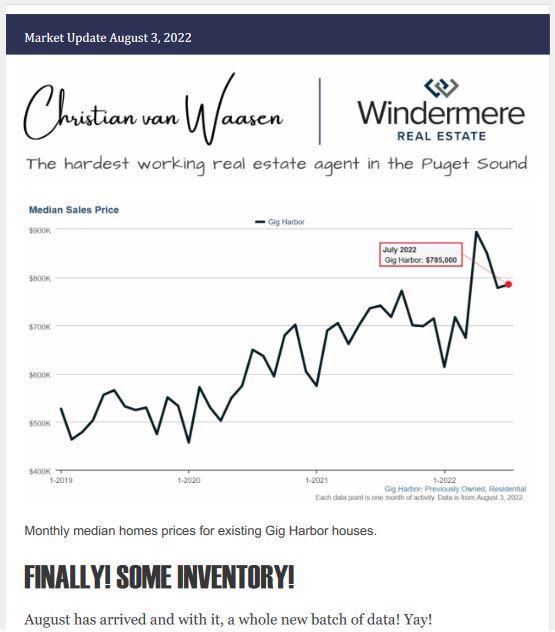
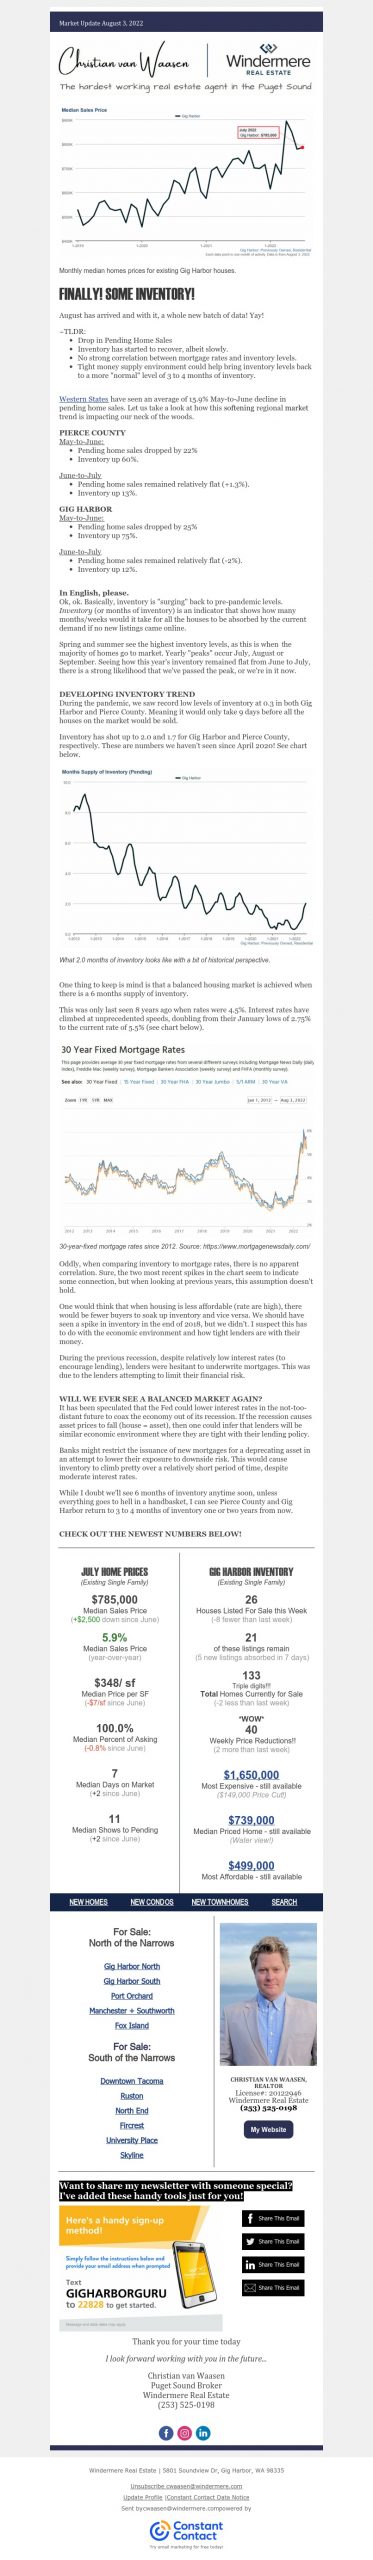
FINALLY! SOME INVENTORY!
August has arrived and with it, a whole new batch of data! Yay!
~TLDR:
- Drop in Pending Home Sales
- Inventory has started to recover, albeit slowly.
- No strong correlation between mortgage rates and inventory levels.
- Tight money supply environment could help bring inventory levels back to a more “normal” level of 3 to 4 months of inventory.
Western States have seen an average of 15.9% May-to-June decline in pending home sales. Let us take a look at how this softening regional market trend is impacting our neck of the woods.
PIERCE COUNTY
May-to-June:
- Pending home sales dropped by 22%
- Inventory up 60%.
June-to-July:
- Pending home sales remained relatively flat (+1.3%).
- Inventory up 13%.
GIG HARBOR
May-to-June:
- Pending home sales dropped by 25%
- Inventory up 75%.
June-to-July:
- Pending home sales remained relatively flat (-2%).
- Inventory up 12%.
In English, please.
Ok, ok. Basically, inventory is “surging” back to pre-pandemic levels. Inventory (or months of inventory) is an indicator that shows how many months/weeks would it take for all the houses to be absorbed by the curren demand if no new listings came online.
Spring and summer see the highest inventory levels, as this is when the majority of homes go to market. Yearly “peaks” occur July, August or September. Seeing how this year’s inventory remained flat from June to July,there is a strong likelihood that we’ve passed the peak, or we’re in it now.
DEVELOPING INVENTORY TREND
During the pandemic, we saw record low levels of inventory at 0.3 in both Gig Harbor and Pierce County. Meaning it would only take 9 days before all the houses on the market would be sold.
Inventory has shot up to 2.0 and 1.7 for Gig Harbor and Pierce County, respectively. These are numbers we haven’t seen since April 2020! See chart below.
This was only last seen 8 years ago when rates were 4.5%. Interest rates have climbed at unprecedented speeds, doubling from their January lows of 2.75% to the current rate of 5.5% (see chart below).
Oddly, when comparing inventory to mortgage rates, there is no apparent correlation. Sure, the two most recent spikes in the chart seem to indicate some connection, but when looking at previous years, this assumption doesn’t hold.
One would think that when housing is less affordable (rate are high), there would be fewer buyers to soak up inventory and vice versa. We should have seen a spike in inventory in the end of 2018, but we didn’t. I suspect this has to do with the economic environment and how tight lenders are with their money.
During the previous recession, despite relatively low interest rates (to encourage lending), lenders were hesitant to underwrite mortgages. This was due to the lenders attempting to limit their financial risk.
WILL WE EVER SEE A BALANCED MARKET AGAIN?
It has been speculated that the Fed could lower interest rates in the not-too-distant future to coax the economy out of its recession. If the recession causes asset prices to fall (house = asset), then one could infer that lenders will be similar economic environment where they are tight with their lending policy.
Banks might restrict the issuance of new mortgages for a deprecating asset in an attempt to lower their exposure to downside risk. This would cause inventory to climb pretty over a relatively short period of time, despite
moderate interest rates.
While I doubt we’ll see 6 months of inventory anytime soon, unless everything goes to hell in a handbasket, I can see Pierce County and Gig Harbor return to 3 to 4 months of inventory one or two years from now.
CHECK OUT THE NEWEST NUMBERS BELOW! (SEE IMAGE)


